

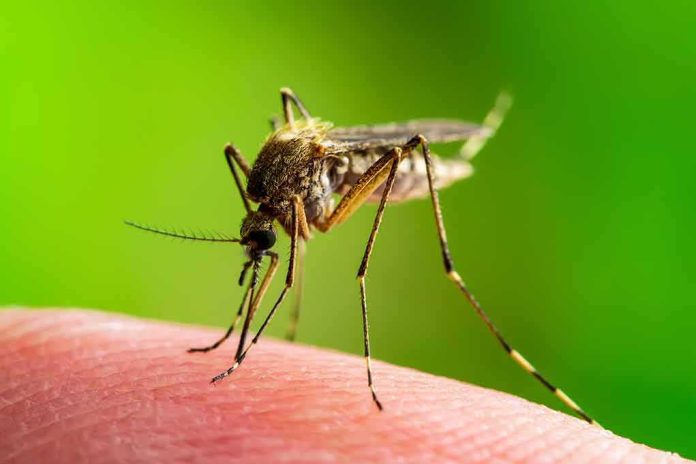
Los Angeles County’s West Nile season was not merely unpleasant; it was measurably more dangerous, with human illness, infected mosquitoes, and virus-positive dead birds all rising together—clear signals of elevated transmission across the county, not just louder anecdotes.
At a Glance
- County health officials reported 100 human West Nile infections and five deaths by late September—an early-season high not seen in nearly a decade.
- Subsequent county surveillance tallied even higher season totals, confirming 2026 exceeded recent baselines for the same period.
- Vector and avian surveillance surged in tandem, with hundreds of positive mosquito pools and a marked rise in infected dead birds—ecological corroboration of widespread virus activity.
- Heat and unusual humidity—linked to longer mosquito lifespans—aligned with the spike, strengthening the mechanism for increased human risk, even as precise attribution shares remain unquantified.
What Actually Happened: A Season of Elevated Risk
By September 21, Los Angeles County had logged 100 reported human West Nile virus infections and five deaths—an early-season count county officials described as the highest in nearly a decade. Those figures did not stall; in updated epidemiologic summaries, the county reported that the 2026 season’s infections exceeded the five-year average for the same calendar window, with total cases and deaths revised upward as reports were reconciled. The progression was textbook for a dynamic arboviral season: early alerts, followed by continued surveillance and later totals that outstripped recent norms.
The signal did not rest on clinical diagnoses alone. Mosquito testing and dead-bird surveillance—the foundation of any credible West Nile early-warning system—climbed sharply. The San Gabriel Valley Mosquito and Vector Control District reported 384 virus-positive mosquito samples and 78 infected dead birds by late September, compared with 104 positive pools and two infected birds at the same point in 2025—a steep, multi-indicator shift that aligns with elevated transmission pressure on people.
Mechanism: How Heat and Humidity Tilt the Odds
West Nile transmission runs through a bird–mosquito–human circuit, with Culex mosquitoes as the principal vectors in Southern California. Several environmental levers move the system. Temperature accelerates viral replication inside the mosquito and shortens the extrinsic incubation period (the time from ingesting virus to becoming infectious). Humidity influences mosquito survival; when relative humidity rises, adult mosquitoes live longer, increasing the odds they survive long enough to transmit. Local vector-control experts captured the point plainly: higher humidity extends mosquito lifespan, and longer-lived infected mosquitoes infect more people.
In 2026, those biological levers aligned. Reporting pointed to record or near-record humidity coupled with sustained heat, with El Niño–related moisture frequently cited as the backdrop for muggy conditions that are atypical for Los Angeles summer and early fall. That combination—warm nights that keep mosquitoes active and moist air that preserves them—stacks risk. It does not require an exotic species bloom to raise human cases; steady survival gains across many Culex cohorts can be enough to push infection prevalence in mosquitoes and birds over the threshold that spills into people.
Surveillance Architecture: Why Multiple Indicators Matter
Public health departments do not infer risk from clinic charts alone. West Nile is notoriously underdiagnosed because most infections are asymptomatic and many mild illnesses never present to care. That is why integrated surveillance—human cases, mosquito pools, and nonhuman vertebrates like birds—remains the standard. The county’s 2026 arc fits that template: early human cases were followed by escalating vectors and avian positives, and then higher consolidated human counts as the season matured and reporting lags closed. In short, independent streams converged on the same conclusion: this season ran hotter.
The operational consequence is lead time. Vector and bird indices typically move ahead of hospitalizations; when they rise above historical baselines, agencies can intensify larval control, adjust adulticide operations to hot spots, and issue targeted public advisories two to four weeks before a wave of human onsets would otherwise arrive. In 2026, districts escalated field work accordingly, including trapping, larviciding, and targeted nighttime spraying when risk justified it—tactics optimized by where and when positive pools clustered.
Caveats Without Confusion: What We Can and Cannot Assign
Two things can be true at once. First, 2026 was a high-activity season by multiple measures, and human health impacts were significant. Second, while heat and humidity clearly make mosquitoes more competent vectors and longer-lived, the proportions of attribution among weather, water management, human behavior, and surveillance effort are not partitioned in a formal model here. County communications used calibrated language—warm winter and humidity “may be contributing”—and the strongest El Niño framing came through media synthesis rather than a published attribution analysis. That does not blunt the practical message; it simply keeps the causal apportionment honest.
Surveillance totals also evolve. Early-season counts (the 100 cases, five deaths) are not “wrong” when later reports list higher totals; they are earlier snapshots. Arboviral reporting necessarily lags because confirmatory testing, jurisdictional reconciliation, and inclusion criteria take time. The county’s own Arbo Report clarifies that 2026 case numbers ran above the five-year average for the same period—a sturdier benchmark than any single mid-season press line.
Comparative Context: Patterns, Not Panic
West Nile in California has always arrived in pulses. The virus established in the state in the early 2000s and has since produced sporadic county-level surges when environmental and ecological conditions align. In Southern California, transmission typically builds through late summer and can extend into November, so late-season rises are not outliers by calendar alone; what matters is the amplitude relative to history and effort. This is why pairing human case counts with mosquito and bird infection data is non-negotiable: together they distinguish a reporting artifact from a bona fide ecological surge.
The 2026 season meets that test. When vector pools, infected birds, and human cases all climb above recent baselines, and when experts can point to a plausible mechanism—heat hastening viral replication and humidity lengthening mosquito survival—the weight of evidence favors a real transmission intensification rather than a mirage of testing volume or media attention.
Los Angeles is facing a significant public health challenge as West Nile virus cases surpass 180. Officials report that record-breaking heat and environmental conditions have created a breeding ground for a surge in Aedes mosquito populations across the pic.twitter.com/PdtWWunW5J
— Azat TV (@azattelevision) October 11, 2026
Implications: How Agencies and Residents Cut Risk
Three operational lessons carry forward. First, integrated surveillance earns its keep: it gives districts weeks of warning to intervene before hospitals feel the brunt, and the 2026 experience underscores using historical thresholds to trigger action. Second, climate variability that brings warmer winters and humid summers is not abstract; in a Culex-dominated system, it converts directly into higher probability of human spillover when other conditions—standing water, susceptible birds—are in place. Third, personal protection remains decisive: eliminating container water weekly, maintaining screens, and using EPA-registered repellents at dusk and dawn are unglamorous but high-yield behaviors during active transmission windows.
What to Watch Next: Better Attribution, Better Targeting
The next tier of precision is technical but tractable: daily temperature and humidity, precipitation, and vapor-pressure deficit linked to mosquito trap data, infection prevalence per pool, and dates of human onset. With that, epidemiologists can fit distributed-lag models to apportion which environmental metrics best predict rising risk in Los Angeles microclimates. That work does not change what happened in 2026; it refines where and when the next inflection point will arrive—and which neighborhoods benefit most from earlier larval control, stormwater management, and community outreach.
Sources:
feedpress.me, lacounty.gov, latimes.com, mynewsla.com